
Table of Contents
Introduction
You have developed an iOS application after hours of coding and adding all the features required to satisfy your customer requirements. Now when you test the application, it fails to run at the speed you expected.
Creating a satisfying and intuitive user interface is paramount for an iOS app. Users are more likely to uninstall an app if it runs poorly or often crashes, hurting an app’s reputation. Developers may prevent this by making their programs fast, responsive, and full of valuable features. Here’s when Xcode’s Profiler comes in handy.
What is the XCode Profiler?
The Profiler in Xcode is an effective tool for pinpointing memory leaks and other application code performance problems. Developers may improve their apps by inspecting their CPU, memory, and network use. The Profiler gives developers the insight they need to implement fine-tuned optimizations that may impact overall performance.
In the article, weXcode’s Profiler and how to optimize your iOS app’s performance. We’ll discuss the many profiling methods available and give you some concrete ideas for using the Profiler’s output. With the knowledge you gain from this tutorial, you’ll be able to use Xcode’s Profiler effectively, resulting in speedier and more stable iOS applications.
How can Xcode’s Profiler can improve the performance of iOS apps?
Xcode’s Profiler helps Ios app developers in several ways: –
When it comes to optimizing the speed of iOS apps, Xcode’s Profiler plays a significant role for developers. To fix performance problems like a sluggish app start, a sluggish UI, or poor memory management, developers may utilize the Profiler to pinpoint the exact lines of code at fault.
The Profiler can profile your system’s processing power, memory, and network activities. Using these various profiling techniques; programmers may analyze an app’s resource consumption and utilization in great detail and isolate problematic code sections.
Analyzing CPU use is one way for developers to determine whether parts of their app’s code use more processing power than needed. Then, to decrease total CPU consumption and enhance app performance, developers may optimize or replace these techniques with more efficient ones.
Instead, profiling memory use helps programmers spot wasteful memory allocation and leaks in the app’s source code. Developers may improve app speed and stability by fixing these problems and using memory better.
Last but not least, profiling network activity lets programmers see how an app uses the network, down to the queries it makes and the time it takes to get replies. Suppose developers make an effort to optimize network utilization. In that case, they can be sure that their apps’ network activity is as efficient as possible, which benefits users by cutting down on wait times and enhancing the apps’ overall performance.
Overall, the Profiler in Xcode is a vital resource for creating high-quality iOS apps since it helps developers pinpoint and fix performance problems that may hurt the app’s reception among users. Using the Profiler’s robust capabilities, programmers may improve the performance, stability, and user experience of iOS applications.
What are the different types of profiling done by Xcode’s Profiler?
To analyze and enhance your app’s performance on iOS or macOS, you may use the profiling tools included in Xcode. To give you an idea of the variety of profiling tools Xcode offers, consider the following:
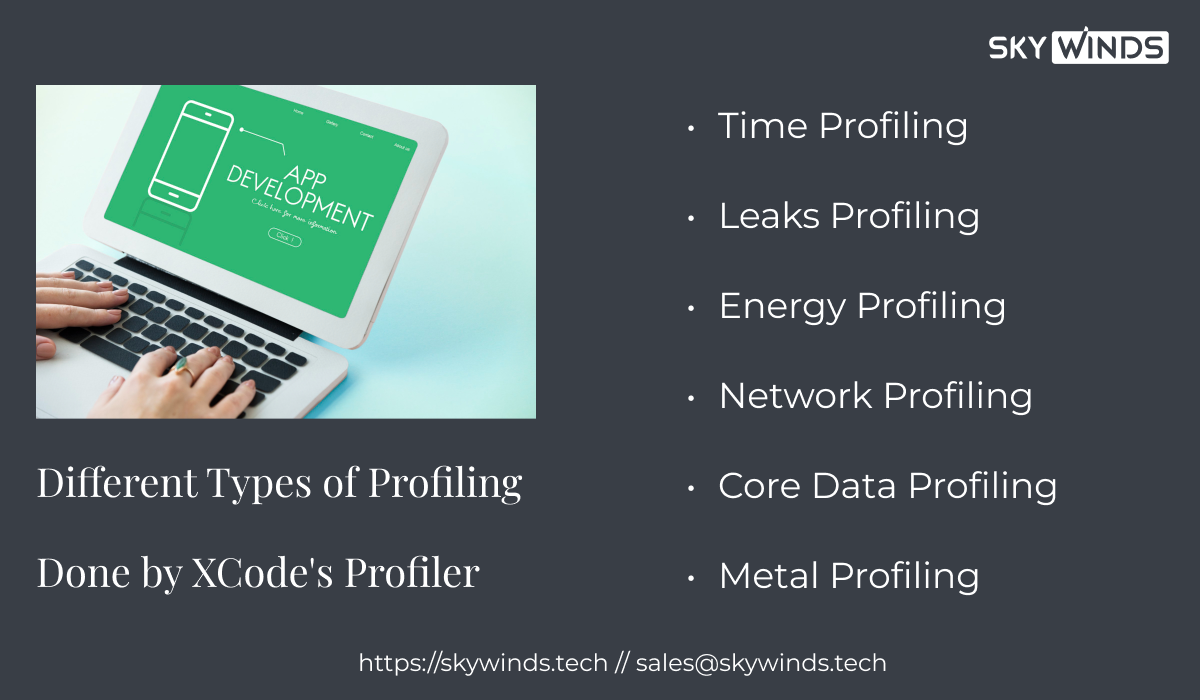
Time Profiling
Your application’s CPU use may be monitored using this Profiler, allowing you to zero in on the methods and operations taxing your system the most. This instrument will let you examine your code’s efficiency and locate any slow spots.
To detect memory leaks, you may monitor how much memory your program uses using the allocations profiler. This instrument will help you track the amount of memory used by your schedule and spot any objects that are not being released correctly.
Leaks Profiling
You may find memory leaks in your program with the help of this Profiler. You may examine the leaked objects and the call stack that caused the leak.
Energy Profiling
The energy profiler provides a method for calculating how much power your program requires. By analyzing how much certain power portions of your program use, you can fix the wasteful ones.
Network Profiling
You may examine your app’s network activity with the help of the network profiler. You may use this to monitor your application’s network activity, including all requests and answers.
Core Data Profiling
It is possible to monitor the Core Data objects and SQL queries executed by your app with the help of the Core Data profiler. This instrument will help you discover slow queries in Core Data and speed them up.
Metal Profiling
When writing graphics code in Metal, you may examine its efficiency with the help of the Metal profiler. This instrument will help you improve your Metal code by pinpointing rendering bottlenecks.
What are the features of Xcode’s Profiler?
For developers working on iOS and macOS, Xcode’s Profiler is an essential tool for pinpointing and fixing performance problems. It comprehensively summarizes how much processing time an app spends, how much memory it uses, and other performance-related factors. A few of the most critical aspects of Xcode’s Profiler are as follows:
To determine which parts of a program using the most processing power or “hotspots,” the Xcode CPU profiler analyzes the app’s execution time. As a result, developers are better able to optimize their code and boost the app’s speed.
The memory profiler in Xcode inspects an app’s use of RAM and reports any problems it finds, such as memory leaks or high RAM consumption. It aids programmers in enhancing the app’s stability and responsiveness by optimizing code and decreasing memory consumption.
An app’s energy use may be analyzed using Xcode’s energy profiler, which then pinpoints the processes draining the most juice. As a result, this is helpful for mobile app developers looking to reduce their program’s energy consumption while enhancing their users’ overall experience.
The network profiler in Xcode examines an app’s traffic and reports where it has slowdowns or other inefficiencies in its network code. Developers may use this information to fine-tune their code and boost the app’s network speed.
Developers may pick and choose which metrics to evaluate and how to show the data since the Profiler in Xcode is very configurable. Because of this, developers may easily concentrate on the most relevant KPIs for their projects and conduct individualized analysis.
What are the advantages of using Xcode’s Profiler?
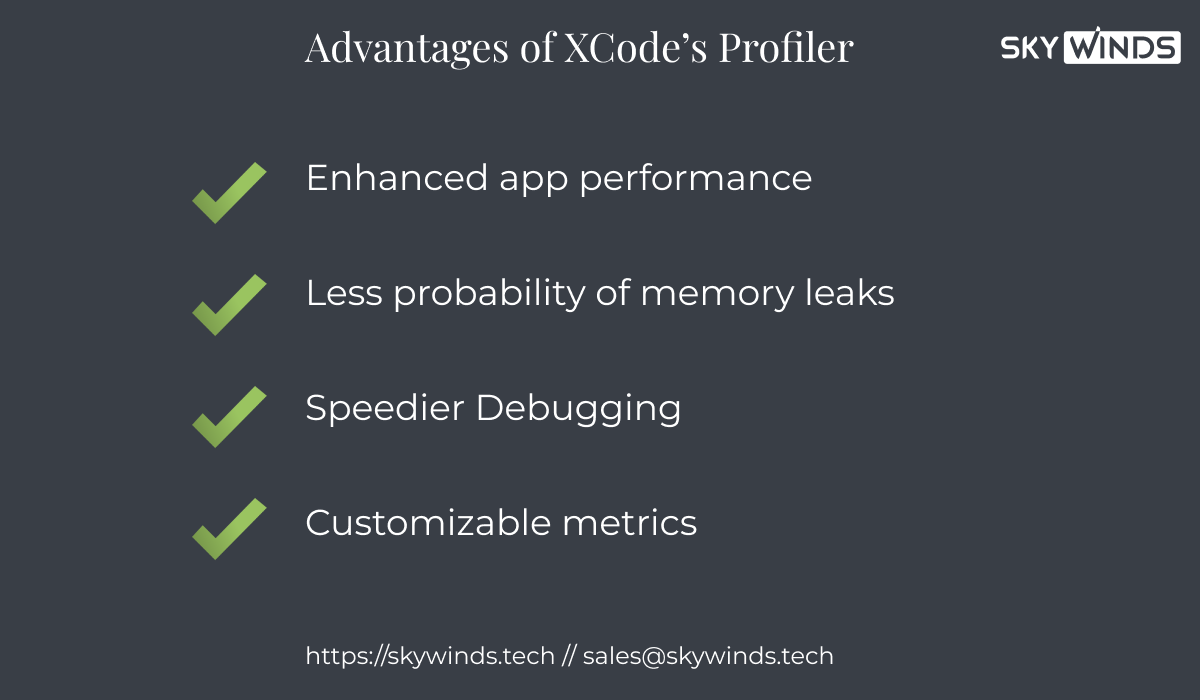
Here are just a handful of the many advantages of utilizing the Profiler in Xcode:
Enhanced app performance:
The significant advantage of utilizing Xcode’s Profiler is that it aids in enhancing the performance of your program. Your app’s CPU utilization, memory allocation, and other performance indicators may all be examined in great detail using the Profiler. By using this data, you may enhance the performance and efficiency of your app’s code.
Less probability of memory leaks:
Using the Profiler in Xcode reduces memory leaks and high memory utilization, which may cause program crashes and other difficulties. Using this knowledge, you better tailor your code to avoid memory leaks.
Increased battery life:
Longer battery life thanks to the Profiler’s ability to profile energy use and pinpoint energy-hungry tasks. The battery life of your app and the overall user experience may both benefit from code optimization for lower energy use.
Speedier Debugging:
The Profiler may shorten the debugging process by highlighting potential problem areas in your code. It gives instant feedback on your app’s performance so that you can see and correct any problems immediately.
Customizable metrics:
Xcode’s Profiler allows you to zero in on the metrics that matter for your app, thanks to its extensive configurability. You may adjust the analysis to fit your demands and get more precise and relevant results.
Therefore, You can enhance your app’s performance, decrease crashes, lengthen battery life, and speed up the debugging process by utilizing Xcode’s Profiler.
When and how should developers use Xcode Profiler?
When appropriately used, Xcode Profiler is an effective instrument for locating slow spots and leaking memory in software. Here are some guidelines for using Xcode Profiler that developers may follow:
Pick out the parts of your codebase you’d want to examine in terms of speed and memory use. It might be a single method, function, or a more significant chunk of your code.
Launch Xcode and enter your project’s Scheme Editor. Run in “Profile” mode by clicking that option.
Use the Profile run action to compile and launch your program. It will launch the app performance analysis tool known as Instruments.
Pick the kind of profiling that interests you. Time profiling, resource allocation, and leak detection are the three most prevalent kinds of profiling.
Set up the parameters for the profiling run. Among other things, you may choose the length of the profiling session and the recordings.
Use Instruments to examine the data for any performance concerns or memory leaks. Analyzing graphs and charts for bottlenecks or call stacks for places where code is spending the most time are two methods for doing this.
Optimize your code based on what you learned throughout the profiling session. It may be necessary to make changes to the legend, the algorithms, or the configuration.
Repeat the process. It would help if you kept profiling and optimizing your code until you’re happy with its performance, which is why profiling is best treated as an iterative process.
By adhering to the procedures above, developers may maximize their applications’ potential and provide their users with the greatest possible experience.
What are the Best Methods of Profiling?
The best techniques for profiling in Xcode are as follows:
Don’t only undertake to profile when you think there could be a problem with performance or memory use; do it consistently during development.
Time Profiler, Allocations, or another tool may be used as a profiling template, depending on your specific requirements.
You may receive the most useful profiling data if you zero in on certain parts of your code.
Don’t only take a snapshot in time, but a record for extended durations to get a whole picture of user behavior in your app.
Look for trends and patterns over time in your collected profile data.
Use profiling to guide optimization efforts such as code rewriting, algorithm swapping, and parameter tweaking.
You should be aware of the potential consequences of profiling on app performance and take action to counteract them.
If you want to take advantage of Xcode’s latest features and the Profiler’s newest enhancements, you should keep up with the latest releases.
You and your team will benefit from having a record of your profiling efforts and results.
Wrapping it up!!!!
Developers creating apps for macOS and iOS should make use of the Xcode Profiler. It comprehensively looks at an application’s performance, pinpointing bottlenecks, slowdowns, and other trouble places. Developers may optimize their code, fix memory leaks, speed up their program, and extend its battery life with the help of its many capabilities, such as CPU profiling, Memory profiling, Energy profiling, Network profiling, and Customizable profiling. The Xcode Profiler is an effective tool that may help developers rapidly find and repair errors in their code, resulting in a more streamlined and effective development process.
The Xcode Profiler is highly adjustable, allowing developers to zero in on the most relevant data and conduct analysis that is particular to their work. Xcode’s Profiler will enable programmers to inspect and analyze their code for inefficiencies, resulting in a more stable and smooth-running app for users.
If you are looking for professional support to optimize the performance of your iOS applications using Xcode profiler, you can hire dedicated iOS app developers from SkyWinds technologies. The talented iPhone app developers at Skywinds are proficient in using Xcode profiler to deliver fast-performing iOS app solutions. Whether providing custom iOS app development services or Swift development services, we assure you of the best quality and fast solutions. Call us now to book a free consultation call to discuss the issues you are facing with the performance of your iOS applications.