In the era of data-driven decision-making, organizations increasingly rely on business intelligence (BI) tools to gain insights from their data. Combining BI with the power of artificial intelligence (AI) and predictive analytics can unlock even more significant potential by enabling organizations to forecast trends and optimize outcomes.
According to a research study published by The Insight Partners in August 2022, the global market for predictive analytics alone has gained significant traction among various organizations.
The study indicates the market size was valued at $12.49 billion in 2022. The report further forecasts that the market is expected to expand to $38 billion by 2028, exhibiting a compound annual growth rate (CAGR) of approximately 20.4% from 2022 to 2028.
Therefore, this article will explore how AI, predictive analytics, and BI can be leveraged together to forecast trends accurately and drive strategic decision-making for optimal results.
AI and Predictive Analytics to Forecast Trends

By the year 2030, it is anticipated that artificial intelligence (AI) will significantly contribute $15.7 trillion to the global economy. This projected value surpasses the combined current output of China and India.
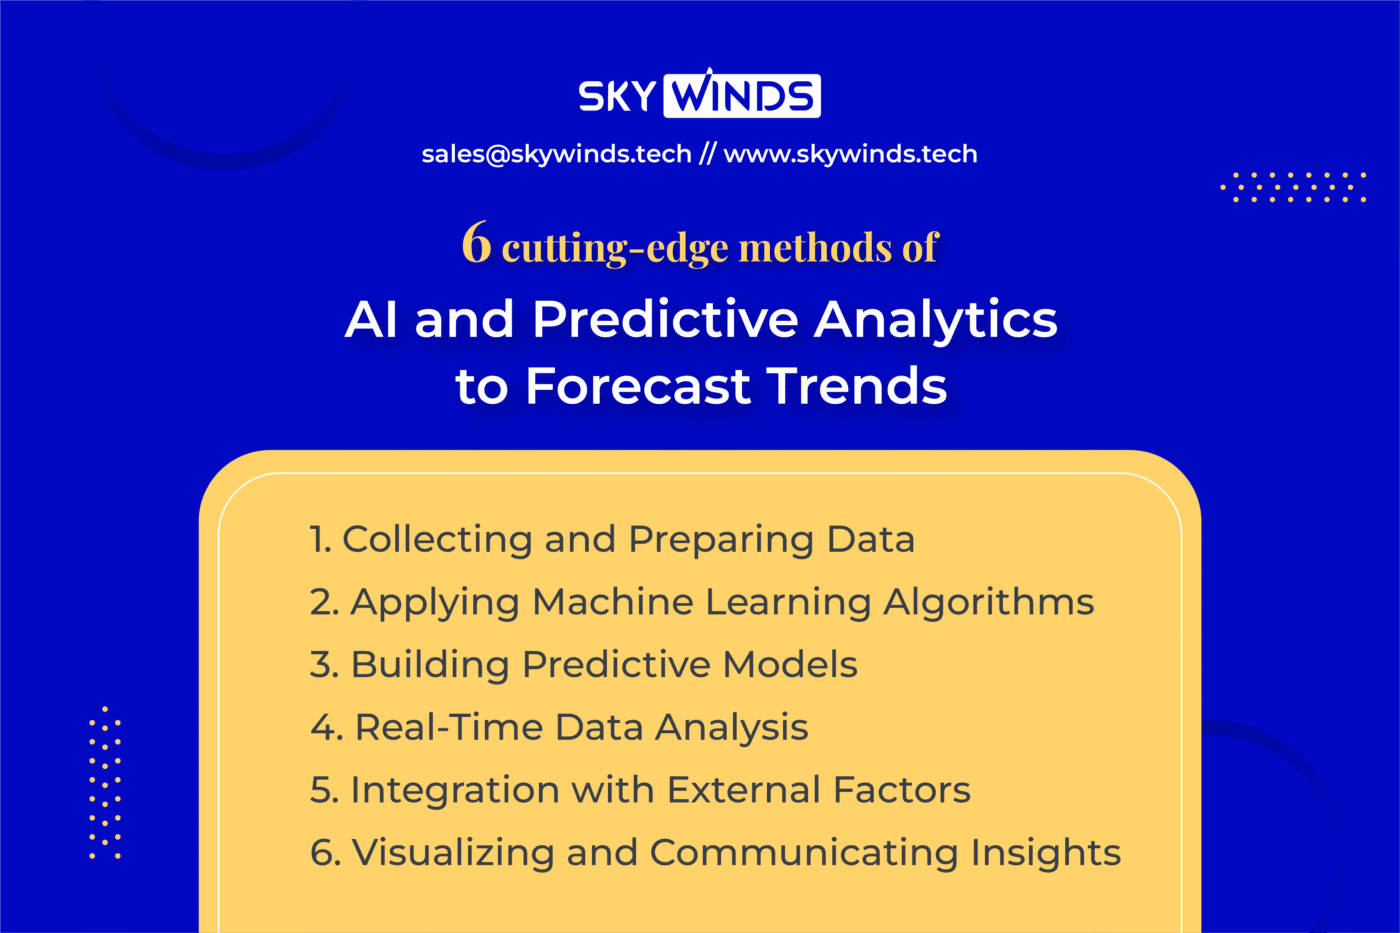
This proves the importance of exploring AI and Predictive Analytics to harness the advantages of forecasting trends. The following steps outline the process to achieve optimal outcomes:
- Collecting and Preparing Data
Approximately 48% of businesses leverage various forms of artificial intelligence (AI) to effectively harness the potential of data. Hence, the first step in utilizing AI and predictive analytics for trend forecasting is to collect and prepare relevant data.
This involves gathering historical and real-time data from various sources, such as customer transactions, social media interactions, market reports, and industry databases. The data should be cleaned, organized, and transformed into a format suitable for analysis.
2. Applying Machine Learning Algorithms
Once the data is ready, machine learning algorithms can be applied to discover patterns and relationships within the dataset. Techniques such as regression, classification, clustering, and time series analysis can be used to uncover hidden insights.
These algorithms can identify correlations, dependencies, and anomalies that human analysts may miss, enabling businesses to gain a comprehensive understanding of the underlying trends.
3. Building Predictive Models
According to a survey, 87% of organizations worldwide believe that AI technologies will provide them with a competitive advantage. Therefore, from the insights gained through AI data analysis, you can develop predictive models. These models use historical data to make predictions about future trends.
For instance, a company may use predictive models to forecast customer demand, market fluctuations, or product performance. By training the models on a large dataset, they can learn from past patterns and provide accurate predictions for future events.
4. Real-Time Data Analysis
It is crucial to incorporate real-time data analysis to adapt to the dynamic nature of trends. By continuously monitoring incoming data, businesses can update their predictive models and adjust their forecasts accordingly. This allows organizations to respond promptly to emerging trends and capitalize on new opportunities.
5. Integration with External Factors
While historical data provides a foundation for trend forecasting, it is also essential to consider external factors influencing trends. AI and predictive analytics can incorporate external data sources such as economic indicators, social media sentiment, news feeds, and weather conditions.
By factoring in these variables, organizations can enhance the accuracy of their trend forecasts and gain a more holistic view of the market dynamics.
6. Visualizing and Communicating Insights
According to findings published in the Rochester review, approximately 50% of the human brain is dedicated to processing visual information. Additionally, a separate study reveals that individuals can retain about 65% of the information three days after viewing an image containing data, as opposed to only 10% of information obtained through auditory means.
Furthermore, another study highlights that most of the human population, precisely 65%, are visual learners, underscoring the importance of visual information for effective retention. All these studies prove the same thing, and data visualization is essential.
To make trend forecasts accessible and actionable, presenting the findings clearly and concisely is crucial. Data visualization techniques such as charts, graphs, and interactive dashboards can be used to communicate insights effectively. Visual representations enable decision-makers to quickly grasp key trends and make informed strategic choices.
How Do You Automate a Process in Power BI for Better Outcomes?
To attain profitable outcomes in business, a diligent approach is required. However, this does not refer to physical labor but instead leveraging the power of BI consulting services.
According to the reports, by 2025, the global market for business intelligence is projected to expand and reach a value of $33.3 billion. So, let’s delve into the steps necessary to achieve the utmost optimization in outcomes through BI.
1. Clearly Define Goals and Key Performance Indicators (KPIs)
To optimize outcomes effectively, starting by clearly defining goals and identifying relevant Key Performance Indicators (KPIs) is essential. Establish specific, measurable, attainable, relevant, and time-bound (SMART) objectives that align with your organization’s overall strategy. These goals will serve as a reference point for performance evaluation and help guide your BI initiatives.
2. Gather and Integrate Relevant Data
Optimizing outcomes requires access to accurate and comprehensive data. Identify the relevant data sources across your organization, including operational systems, sales data, customer data, marketing metrics, and financial records. Integrate this data into a centralized data warehouse or data lake to create a unified view for analysis and reporting.
3. Implement Robust Data Analytics and Visualization Tools
70% of organizations think that data discovery and visualization are vital. So, select a robust BI tool or power BI service company platform that provides advanced data analytics and visualization capabilities.
These tools allow you to explore and analyze your data effectively, uncover insights, and visualize trends and patterns. Interactive dashboards, charts, and graphs enable decision-makers to understand complex information at a glance and make data-driven decisions quickly.
4. Perform Data Analysis and Extract Insights
Utilize the analytical capabilities of your BI tool or power BI consulting company to conduct in-depth data analysis because data analytics makes decision-making 5x faster for businesses. Apply analytical techniques, such as descriptive, diagnostic, predictive, and prescriptive analytics, to gain actionable insights.
Identify trends, correlations, and anomalies in the data that can help optimize outcomes. For example, analyzing customer behavior can lead to more targeted marketing campaigns or improved customer service strategies.
5. Monitor and Measure performance
Business Intelligence consulting firms enable organizations to monitor and measure performance against established KPIs in real-time. Establish a system for ongoing monitoring of critical metrics and performance indicators through your BI platform.
Set up alerts and notifications to proactively address any deviations from desired outcomes. Regularly review and analyze the performance data to identify areas for improvement and make informed decisions.
6. Enable Self-Service Analytics
Most businesses, exceeding 46%, have already incorporated a business intelligence (BI) tool as a fundamental component of their business strategy. So, empower business users across your organization with self-service analytics capabilities.
Please provide them with access to the BI tools and dashboards, allowing them to explore and analyze data independently. Self-service analytics promotes a data-driven culture, encourages collaboration, and enables stakeholders to make informed decisions at their level, reducing dependence on IT teams.
7. Continuously Improve and Evolve
Optimizing outcomes is an iterative process. Regularly evaluate the effectiveness of your BI initiatives and identify areas for improvement. Collect feedback from users and stakeholders to understand their needs and enhance the BI consulting services solution accordingly.
Stay updated with new trends and advancements in BI technology to leverage emerging capabilities that can further optimize outcomes.
What is Microsoft Power BI Used for?

Microsoft Power BI is a business intelligence tool for data analysis and visualization. It allows users to gather, transform, and analyze data from various sources and create interactive reports, dashboards, and visualizations to gain insights and make data-driven decisions.
Power BI provides a user-friendly interface and a wide range of data connectors to extract data from databases, cloud services, Excel files, and more.
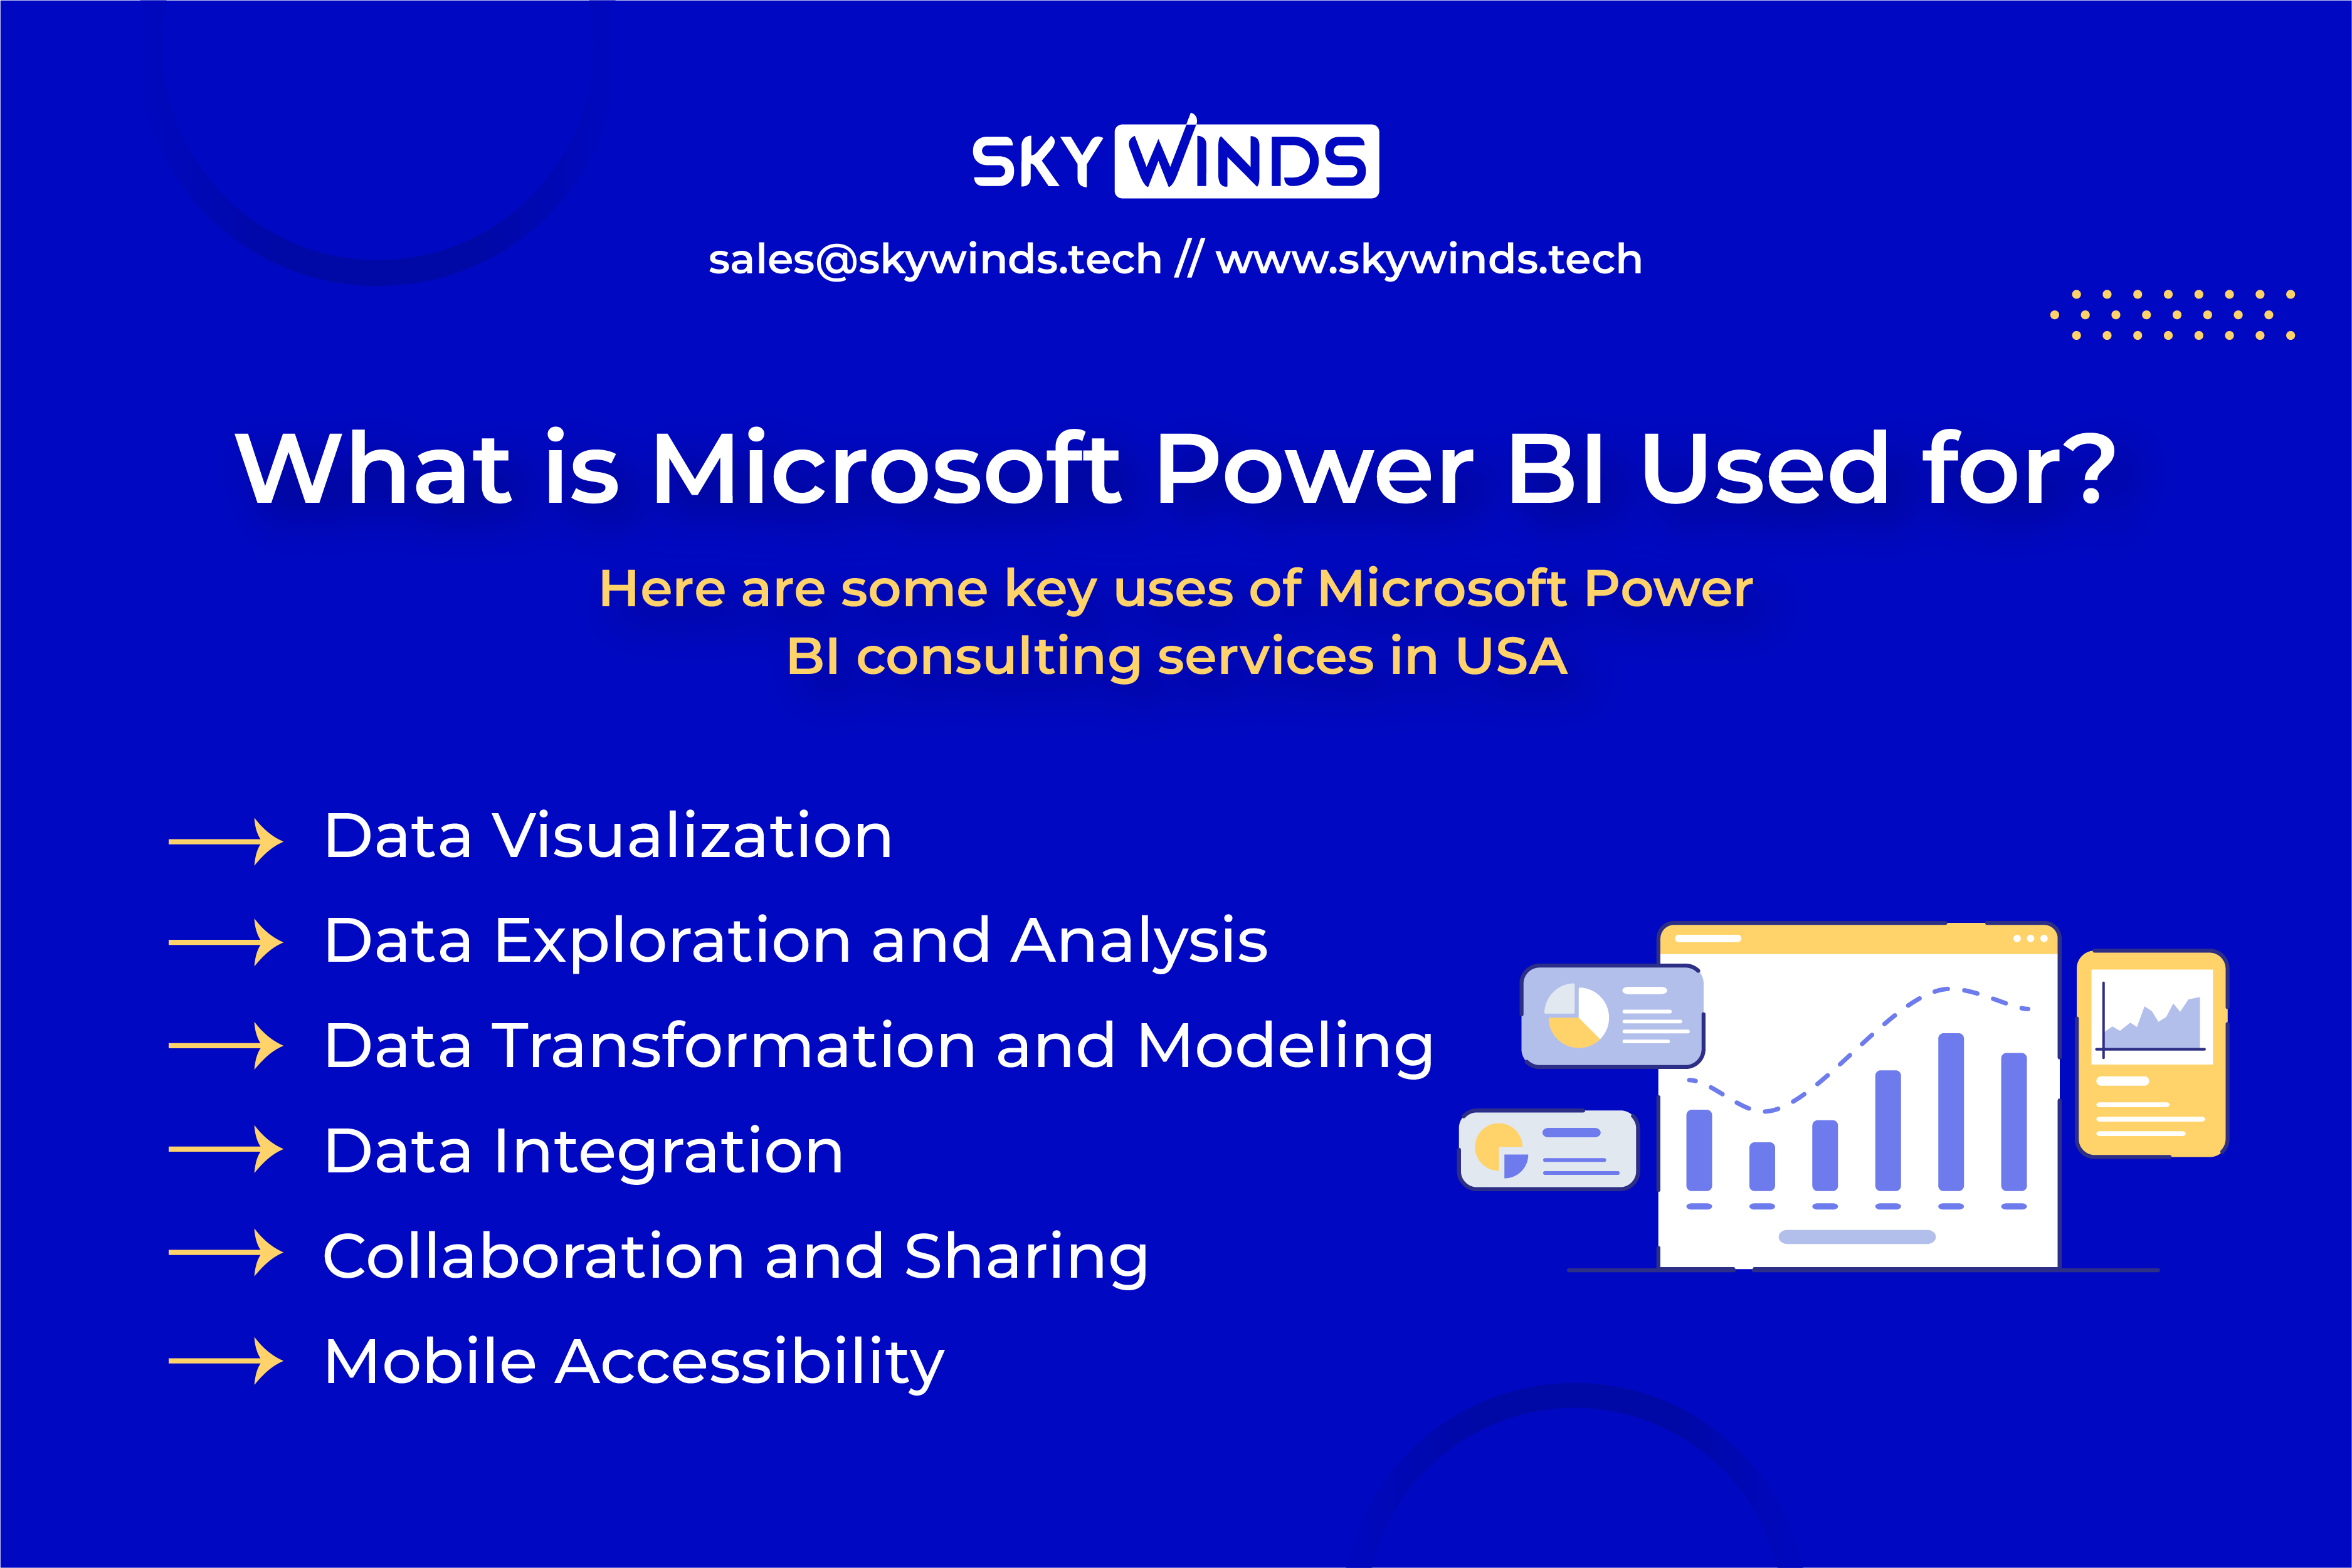
Here are some critical uses of Microsoft Power BI consulting services in the USA:
Data Visualization: Microsoft Power BI consultant enables users to create interactive and visually appealing Microsoft Power BI dashboards and reports. It offers a variety of visual elements such as charts, graphs, maps, and tables to represent data meaningfully.
Data Exploration and Analysis: Users can explore data from different angles, identify patterns, and discover insights by applying various data analysis techniques within Power BI. It provides features like filtering, sorting, drill-down, and creating custom calculations and measures.
Data Transformation and Modeling: Power BI includes capabilities for data preparation and transformation. Users can clean and shape data using Power Query, a data extraction and transformation tool within Power BI. Additionally, Power BI supports data modeling to establish relationships between different data tables.
Data Integration: Power BI integrates with many data sources on-premises and in the cloud. It supports connections to popular databases, cloud services, Excel files, SharePoint lists, and more. This allows users to consolidate data from various sources and create unified reports.
Collaboration and Sharing: Power BI provides features for collaborating and sharing reports and dashboards. Users can publish their reports to the Power BI service or share them with others within their organization. Additionally, Power BI allows embedding reports in other applications or websites.
Mobile Accessibility: Power BI offers mobile apps for iOS and Android, allowing users to access and interact with their reports and dashboards on mobile devices. This enables users to stay connected and make data-driven decisions while on the go.
Conclusion
By combining AI, predictive analytics, and BI, organizations can unlock the power of data to forecast trends accurately and optimize outcomes. However, it is crucial to remember that the success of AI and predictive analytics relies on data quality, model accuracy, and human expertise.
So, embrace the potential of these technologies today to gain a competitive edge and drive sustainable growth in this data-driven world but smartly.

