
Organizations rely on practical data visualization tools when making data-driven decisions. Microsoft Power BI has emerged as one of the leading business intelligence platforms, offering robust features to analyze and present data. However, to make the most of Power BI, companies often seek the expertise of Power BI consultants. This article will delve into the intriguing world of custom visualizations in Power BI consulting services. These visualizations, designed by consultants, offer a unique perspective on data, enabling organizations to gain insights that are not readily apparent and enhance their decision-making processes.
Understanding power BI consulting services
In the era of data-driven decision-making, power BI consulting services have emerged as a critical resource for businesses seeking to leverage their data effectively. These services, provided by skilled power BI consultants, offer a comprehensive approach to business intelligence (BI) that can transform raw data into actionable insights.
While there is a cost associated with these services, the long-term benefits of using Power BI effectively, such as improved decision-making and increased operational efficiency, often outweigh the initial investment.
What are Power BI consulting services?
Power BI consulting services are about a gamut of activities that assist businesses in executing and making the most out of Microsoft Power BI, one of the best business analytics tools. These can be anything from basic setup to comprehensive management as well as training.
The training bit is key because it guarantees that your team has got what it takes to utilize Power BI properly. This could mean just knowing how to use it or be able to do the most advanced data analytical techniques and methods. It is aimed at helping enterprises maximize some value from their information by using it as an instrument for decision-making and strategic planning.
Expertise in Microsoft Power bi consultants:
Microsoft power BI consultants bring a lot of skills to the table. They don’t just know the technical aspects of Power BI but also comprehend business processes and data analysis techniques.
These competencies permit them to develop Power BI solutions that suit a company’s purposes and goals and consider its needs, challenges, and opportunities. After understanding your business, its peculiarities, and objectives, they use their technological prowess to create custom-made answers for your case.
A Microsoft Power BI consultant can enable an organization to unleash its data’s full power. They will show how best to use Power BI to produce visuals that are easily understood and actionable. They can also give some directions about the right approaches for handling data or how it should be analyzed, thus ensuring that any information used within Power Bi has been properly validated from a correct perspective.
Importance of tailored solutions to meet specific business needs.
One key advantage of using such services is that they deliver customized solutions. Each company is unique regarding what kind of data they have and what they require concerning business intelligence (BI). A Microsoft Power BI consultant knows this fact and will collaborate closely with you to develop a solution that meets your requirements.
This could involve creating custom dashboards that track the metrics most important to the business, integrating Power BI with other software the business uses, or providing training tailored to the needs of the company’s staff. The result is a BI solution that is not only powerful and effective but also fits seamlessly into the business’s operations and workflows.
The role of custom visualizations in Power BI consulting services:
In the realm of data analytics, the significance of data visualization cannot be overstated. Among the many tools available for this purpose, Power BI, a service provided by Microsoft, stands out due to its robust capabilities and flexibility. One of the key features that sets Power BI apart is its support for custom visualizations. In this article, we will delve into the role of custom visualizations in Power BI and how they enhance data interpretation.
Definition and importance of custom visualizations in data analytics:
Custom visualizations generally refer to custom graphs or pictures that portray information beyond pie charts, tables, and bar graphs, usually found in data analytics tools. These visuals are unique and not generic like those, which makes them poor reflectors of your data, unlike the common standard ones. However, they can be used effectively in other situations.
Data visualization is significant because it takes complex data sets and simplifies them into understandable forms. By being highly customizable, some even more than this, bespoke visualizations go one step further than this.
How custom visualizations in Power BI enhance data interpretation:
Visuals developed in Power BI are used as instruments of discovering meaning from the raw facts contained within the given databases. By customizing the images to suit their specific needs, Power BI allows enterprises to draw greater value from their information assets.
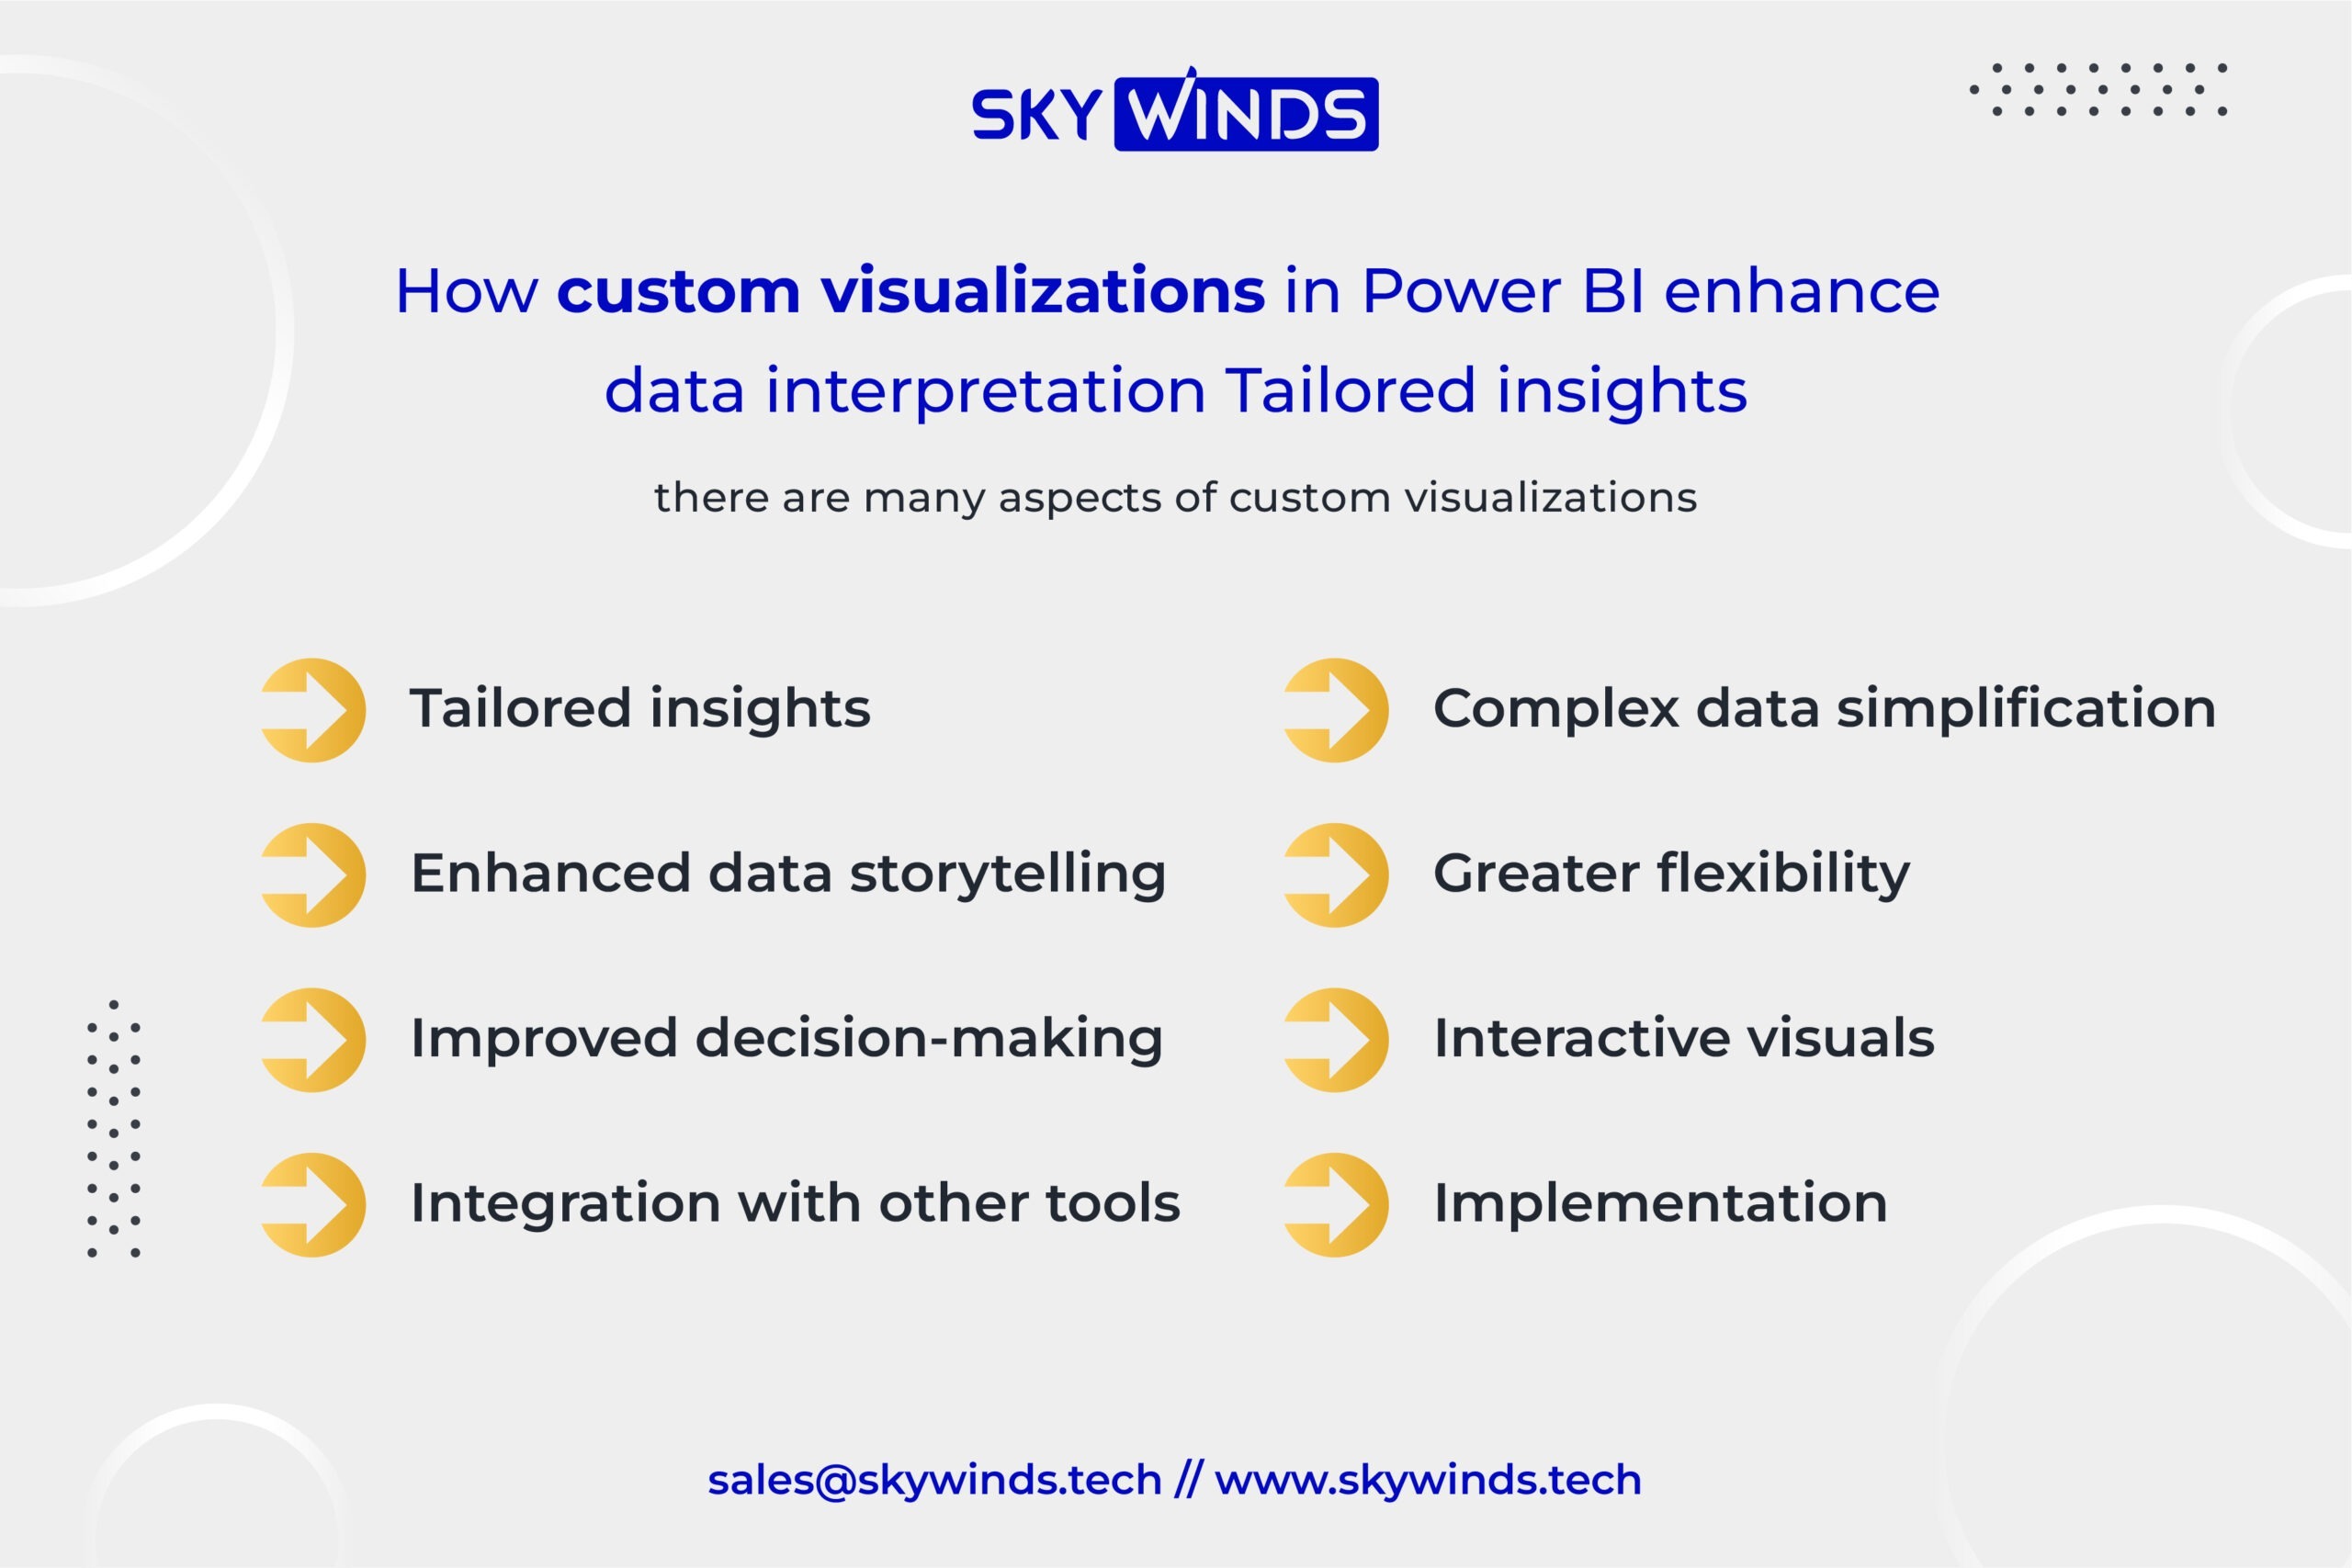
However there are many aspects of custom visualizations:
- Tailored insights: Business organizations can change these images to reflect on what exactly they want. This means they can highlight the most relevant insights, making it easier to interpret and understand the data.
- Complex data simplification: Custom visualizations simplify complex data sets and present them in an easy-to-understand manner. This makes it easier for businesses to interpret their data and make informed decisions.
- Enhanced data storytelling: Custom visualizations improve data storytelling by presenting data in a visually appealing format. This makes the data easier to understand and more engaging, which can help businesses communicate their insights more effectively.
- Greater flexibility: With custom visualizations, businesses are not limited to the standard charts and graphs typically available in data analytics tools. This greater flexibility allows them to present their data in the way that best suits their needs, enhancing data interpretation.
- Improved decision-making: Custom visualizations in Power BI enable businesses to extract more meaningful insights from their data, supporting improved decision making. Companies can use these insights to drive strategy and make more informed decisions.
- Interactive visuals: Power BI’s custom visualizations allow users to drill into the data for more detailed insights. This interactivity enhances data interpretation by allowing users to explore the data deeply.
- Integration with other tools: Custom visualizations in Power BI can be integrated with other tools and platforms, providing a more comprehensive view of the data. This integration enhances data interpretation by providing a more complete picture of the business.
- Implementation: A Power BI consultant or specialist can assist businesses in implementing custom visualizations. These professionals deeply understand the technical aspects of Power BI and their clients’ business needs, allowing them to create custom visuals that accurately represent the data and highlight the insights most relevant to the business.
Examples of custom visualizations and their impact on storytelling
Custom visualizations can take many forms, depending on the needs of the business. For example, a business might use a custom map visualization to display geographical data, or a custom scatter plot to explore the relationship between two variables.
The impact of these custom visuals on storytelling is significant. Presenting data in a visually appealing and easy-to-understand format makes it easier for businesses to communicate their insights to others. This can be particularly useful in presentations, where complex data needs to be conveyed clearly and concisely.
Benefits of custom visualizations in Power BI consulting services:
In the world of data analytics, data visualization is paramount. Among the various tools available, Power BI, a service provided by Microsoft, stands out due to its robust capabilities and flexibility. A key feature that sets Power BI apart is its support for custom visualizations.
Improved Data Comprehension Through Interactive Visualizations
One of the primary benefits of custom visualizations in Power BI is improved data comprehension. Power BI’s custom visuals are interactive, allowing users to drill into the data for more detailed insights. This interactivity enhances data interpretation by allowing users to explore the data deeply.
A Power BI consultant or specialist can assist businesses in implementing custom visualizations. These professionals deeply understand the technical aspects of Power BI and their clients’ business needs, allowing them to create custom visuals that accurately represent the data and highlight the insights most relevant to the business.
Increased Engagement and Stakeholder Buy-In
Custom visualizations in Power BI can significantly increase engagement and stakeholder buy-in. Presenting data in a visually appealing and easy-to-understand format makes it easier for businesses to communicate their insights to others. This can be particularly useful in presentations, where complex data needs to be conveyed clearly and concisely.
A Microsoft Power BI consulting services can guide businesses through the process of creating and implementing custom visuals, ensuring that they are able to make the most of this powerful feature.
Facilitation of Informed Decision-Making Processes
Custom visualizations in BI consulting services enable businesses to extract more meaningful insights from their data, supporting improved decision-making. Businesses can use these insights to drive strategy and make more informed decisions.
Custom visualizations have been instrumental in the evolution of Power BI consulting services. As businesses have become more data-driven, the need for tools to provide deeper, more meaningful insights has grown. Custom visualizations have played a vital role in this evolution.
Case Studies: The Impact of Custom Visualizations in Power BI Consulting Services
In this section, we will explore real-world examples that showcase the effectiveness of custom visualizations in Power BI consulting services. These case studies highlight the results achieved and lessons learned from implementing custom visualizations.
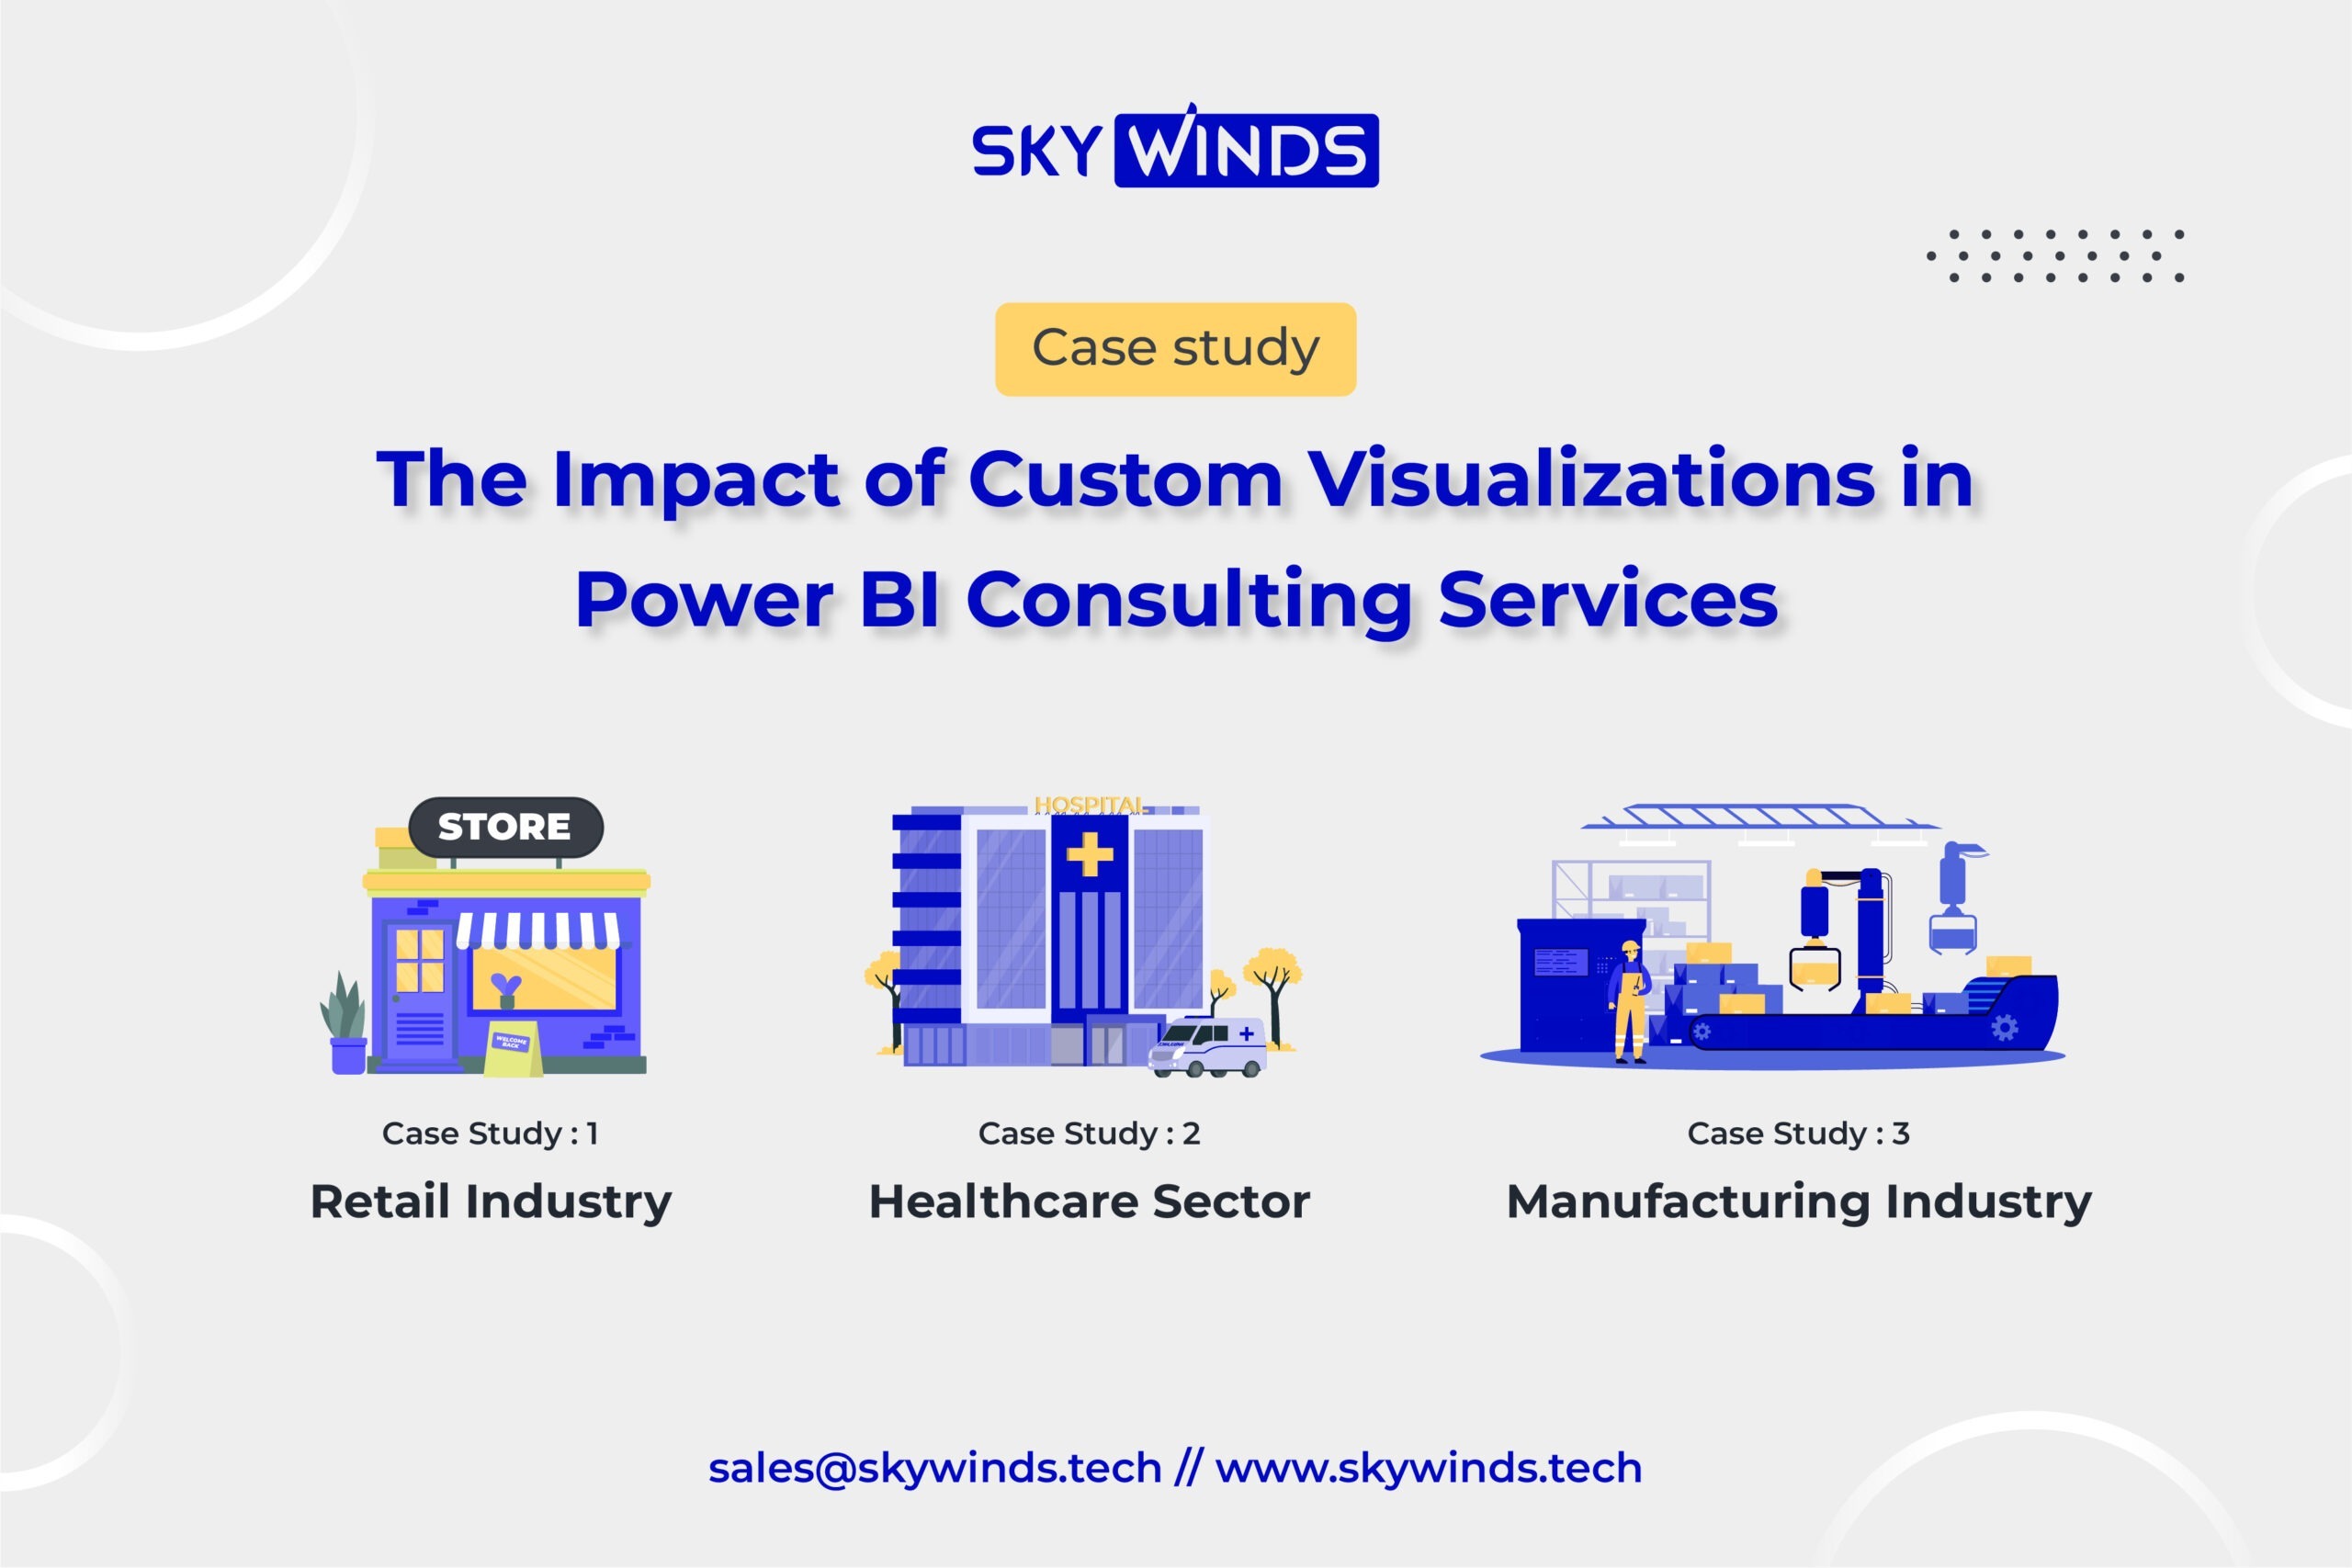
Case Study 1: Retail Industry
A large retail chain needed help with data interpretation due to the vast amount of data generated across its numerous stores. They engaged a Power BI consultant to help them make sense of their data.
The consultant implemented custom visualizations in Power BI, allowing the retailer to view sales data by region, store, and product category in an interactive dashboard. This improved data comprehension and enabled the retailer to identify trends and patterns they were previously unaware of.
As a result, the retailer made more informed decisions about inventory management and sales strategies, leading to increased revenue and reduced costs.
Case Study 2: Healthcare Sector
A healthcare provider wanted to improve patient care by leveraging data from electronic health records. To this end, they engaged a Microsoft Power BI consultant.
The consultant created custom visualizations in Power BI that allowed the healthcare provider to track patient outcomes and treatment effectiveness. These visualizations provided previously hidden insights in the raw data, enabling the healthcare provider to identify areas for improvement and implement changes.
The result was improved patient care, with measurable improvements in patient outcomes.
Case Study 3: Manufacturing Industry
A manufacturing company wanted to improve its production efficiency. They engaged a Power BI specialist to analyze their production data and identify areas for improvement.
The specialist used custom visualizations in Power BI to create an interactive dashboard displaying real-time production data. This allowed the manufacturing company to identify bottlenecks in their production process and take immediate action to resolve them.
As a result, the manufacturing company significantly improved its production efficiency, leading to increased productivity and reduced costs.
Best Practices for Utilizing Custom Visualizations in Power BI
In data analytics, custom visualizations play a pivotal role in conveying complex data in an easily digestible format. When utilized effectively, they can significantly enhance the comprehension and interpretation of data. Here are some best practices for utilizing custom visualizations in Power BI.
Tips for selecting appropriate visualizations based on data type and audience
1. Understand your data:
Before selecting a visualization, it’s crucial to understand the nature of your data. Different data types may require different visualizations. For instance, bar charts might best represent categorical data, while continuous data could be better suited to line graphs.
2. Know your audience:
The choice of visualization should also consider the audience’s familiarity with data interpretation. For a technical audience, more complex visualizations may be appropriate. However, simpler, more intuitive visuals might be more effective for a general audience.
Use appropriate visuals:
Power BI offers a wide range of visuals, each suited to different types of data and insights. Pie charts are great for showing proportions, while scatter plots are ideal for showing correlations.
Importance of maintaining consistency and clarity in visualization design:
1. Consistency:
Maintaining consistency in your visualizations helps create a seamless user experience. This includes consistent use of colors, fonts, and styles across all visuals.
2. Clarity:
Visualizations should be designed to convey information as clearly and simply as possible. Avoid cluttering your visuals with unnecessary elements and ensure that all labels and legends are easy to read and understand.
Future trends in power bi consulting:
As businesses continue to recognize the value of data-driven decision-making, the demand for advanced data visualization tools like Power BI is on the rise.
Emerging technologies and techniques shaping the future of data visualization:
- Artificial intelligence (AI) and machine learning (ML):
AI and ML are increasingly being used to automate data analysis and visualization. This can help businesses uncover hidden patterns and insights in their data.
- Real-time data visualization:
As the need for real-time data increases, Power BI continually improves its capabilities to support real-time data streaming and visualization.
- Mobile data visualization:
With the increasing use of mobile devices, there is a growing demand for visualizations that are optimized for mobile viewing. Power BI is continually evolving to meet this need.
Predictions for the evolution of power BI consulting services
- Increased demand for customization:
As businesses become more data-savvy, there is likely an increased demand for custom visuals that can cater to specific business needs.
- Integration with other microsoft products:
As part of the Microsoft suite of products, Power BI is expected to offer deeper integration with other Microsoft products, providing a more seamless user experience.
- Advancements in AI and ML capabilities:
As AI and ML continue to advance, we can see these technologies play a bigger role in Power BI consulting services, from automated data cleaning to advanced predictive analytics.
Conclusion
In this blog post, we delved into the world of Power BI consulting services, focusing on the role of custom visualizations. We discussed the best practices for utilizing custom visualizations, including tips for selecting appropriate visuals based on data type and audience, and the importance of maintaining consistency and clarity in visualization design.
Through real-world case studies, we saw the transformative impact of custom visualizations on businesses across various sectors, from retail and healthcare to manufacturing. These examples underscored the power of custom visualizations in driving improved decision-making and business outcomes.
Whether you’re working with a Power BI consultant or a Microsoft Power BI consultant, custom visuals are a powerful tool for any data-driven business. They truly represent the next frontier in data analytics, promising a future where data insights are more accessible, understandable, and actionable than ever before.

